If you work in tech, your equity comp probably gave you a meaningful concentrated position in your employer's stock. RSU vests stack year over year. ISO and NSO grants sit on top. By the time you notice, your "diversified portfolio" might be 60% one ticker. The question is not whether to diversify. It's how to diversify without giving back half your gains to capital-gains tax, or panicking out of the position at the worst moment. Five common traps decide which side you end up on.
Concentration risk shows up in the distribution of outcomes, not the average. Your gut is calibrated to the average.
The five most expensive concentration mistakes
The only thing worse than concentration is the mistakes you make trying to resolve it. Here are the five bad ones:
- Refusing to sell because of the tax bill. Holding to avoid tax sounds smart until your stock drops 50% (META, NFLX, PYPL all did in 2022) and you panic-sell at the bottom. The realized loss usually beats the tax you were avoiding. Our calculator runs the drawdown math on your specific volatility.
- Lumping all sales into one tax year. A $400K sale at 20% LTCG plus 5% state plus 3.8% NIIT costs $115K in tax. Spread the same sale across three years and each year lands lower in your income stack, possibly into the 15% LTCG bracket and under the NIIT threshold, with the cash from earlier sales reinvested in the meantime. Spreading is the default unless your return assumptions strongly favor lump-sum.
- Selling everything in a panic after a drawdown. The mirror image of mistake 1: selling the entire position the day after a 30% drop, which locks in the loss without recovery upside. A pre-committed multi-year schedule or Rule 10b5-1 plan (for insiders) removes the choice; a protective hedge caps the downside so the choice doesn't feel as urgent. Either path keeps panic out of the math.
- Hedging without modeling the cost. A naive protective put on a single stock can cost 2-4% of position value per year. Over a decade, that's a quarter of your starting value. Hedging is a tool, not a default; the zero-cost collars article covers when the math works and when it doesn't.
- Ignoring upstream events. Your concentration position is rarely the only thing happening. Future RSU vests add more shares of the same name, ISO exercises trigger AMT and usually add concentration if you hold, and ongoing salary feeds the cycle. The right sell-down schedule depends on the whole picture, not just today's position. The AMT crossover, NSO sell-vs-hold, and RSU withholding gap articles cover the upstream pieces.
Each trap is worth a closer look once you have the framework down. The rest of this article walks through how to quantify your own exposure, the two first-line tools (sell or hedge), multi-year sale schedules, and several specialized structures further down for narrower situations: founder stock (QSBS), exchange funds, long-short loss-harvesting funds, insider trading plans (10b5-1), philanthropic intent (CRTs), or estate planning.
Why one stock is a much bigger risk than the index
Hendrik Bessembinder's 2018 study of every CRSP-listed US stock from 1926 to 2016 found something that should change how everyone thinks about single-stock exposure: the median individual stock returned less than one-month Treasury bills over its lifetime. The entire wealth premium of the US stock market over T-bills, across 90 years and 25,000+ tickers, came from the top 4% of stocks. The other 96% collectively underperformed Treasuries.
Put another way: the market's long-term outperformance is real, but it comes from a small handful of huge winners hidden inside a much larger pile of mediocre and bad outcomes. The index does well. The median name does not. When you concentrate in one stock, you are betting that yours is one of the 4%, not one of the 96%.
Maybe yours is. The point is not that you're wrong about your company. The point is that the concentration itself is a bet with much wider outcomes than the bet you're making when you hold the index.
Quantifying your own exposure
The right starting point is two numbers:
- Position value: the current market value of your single-stock holding (vested RSU shares + exercised ISO/NSO shares + employee stock purchase plan shares)
- Liquid net worth: your investable assets (brokerage, retirement accounts, cash). Exclude home equity and other illiquid assets that aren't going to help you in a drawdown
The ratio of the first to the second is your concentration percentage. Common benchmarks from wealth-management practice: any single-stock position above 10% of liquid net worth is worth actively managing, and anything above 25% materially shapes your financial outcomes.
Sell down or hedge?
The two most direct tools are selling shares and hedging with options. Most thoughtful plans use both. The specialized structures further down cover narrower situations like founder stock (QSBS), exchange funds, long-short loss-harvesting funds, insider trading plans (10b5-1), philanthropic intent (CRTs), and estate planning; they layer on top where they apply. Start here with sell vs. hedge to set the baseline.
Sell down (and pay capital-gains tax)
Selling shares converts concentrated single-stock exposure into cash you can re-diversify. The cost is the capital-gains tax you trigger on the way out: long-term rates (0-20% federal, plus 3.8% NIIT per Form 8960, plus state) if you've held the shares 12+ months from exercise or vest, short-term ordinary rates if you haven't.
The tax is real, but so is the certainty. You've now locked in a known cost (the tax) in exchange for an open-ended reduction in risk. Selling is the path that completes cleanly: no future repricing, no ongoing premium, no option expirations to manage.
Hedge with options (and pay premium each year)
Buying a protective put on your position protects you below the put's strike for the life of the contract, in exchange for the premium. Adding a short call above the current price funds the put, at the cost of capping your upside above the call strike. That structure is a zero-cost collar, covered in depth in the zero-cost collars article.
Hedging preserves your upside above the call strike, defers any tax event (you still own the shares), and converts an open-ended concentration risk into a bounded one defined by the put strike. The cost is the premium drag (typically 2-4% per year for a 30%-out-of-the-money put on a single-stock position) and the upside cap from the short call leg.
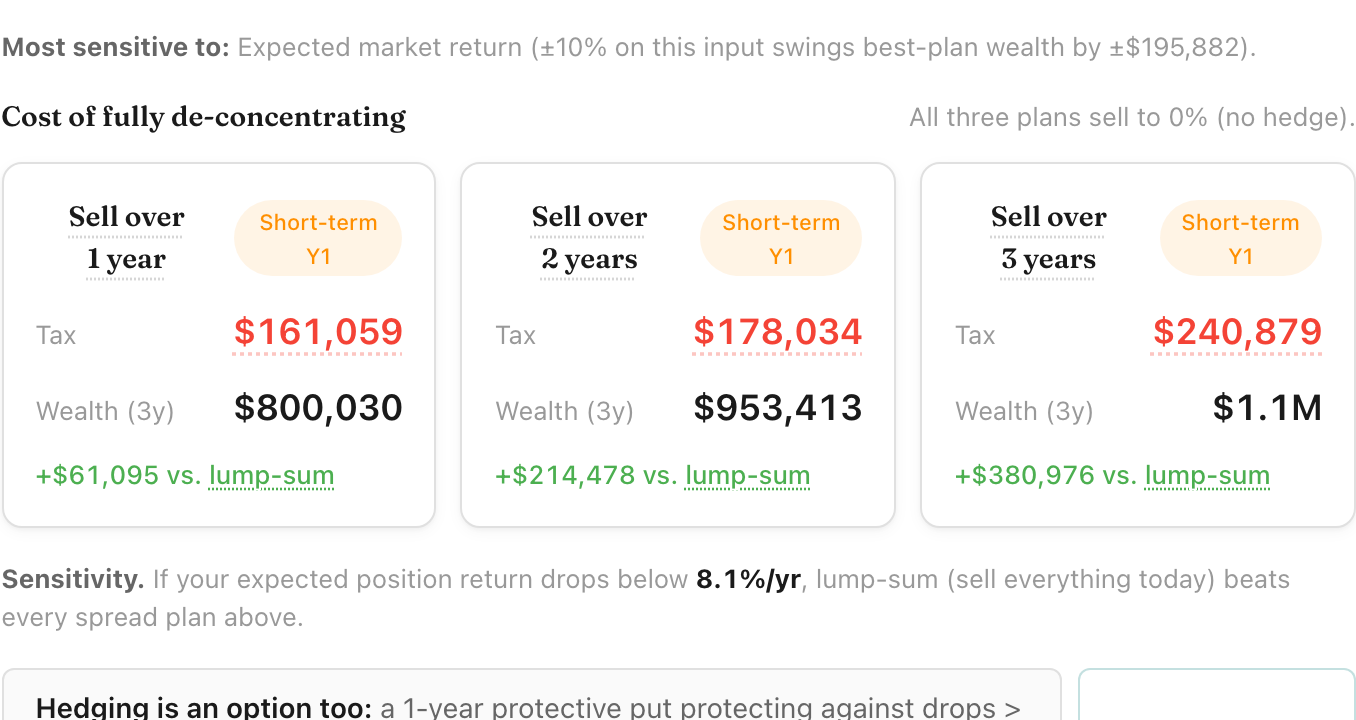
Multi-year scheduled sales
Selling everything in one year is usually not the right move when the position is large. A single $400K sale at 20% LTCG plus 5% state plus 3.8% NIIT costs $115K in tax. Spread the same sale across three years, and each year's sale lands lower in your income stack, possibly into the 15% LTCG bracket, possibly under the NIIT threshold, with the cash from earlier sales reinvested in the broad market in the meantime.
Spreading is not always better. The crossover where lump-sum starts to beat spreading depends on:
- Your expected market return on the reinvested cash. Higher expected returns make spreading less valuable, because you forgo broad-market growth on the unsold portion.
- The expected continued return on the concentrated position. Higher expected returns make holding the position longer attractive, but expectations are much wider for one stock than for the index, which feeds back into the concentration argument.
- Your filing status and total income. Spreading helps more when adding a sale to your bracket would push you over the NIIT or top-LTCG thresholds.
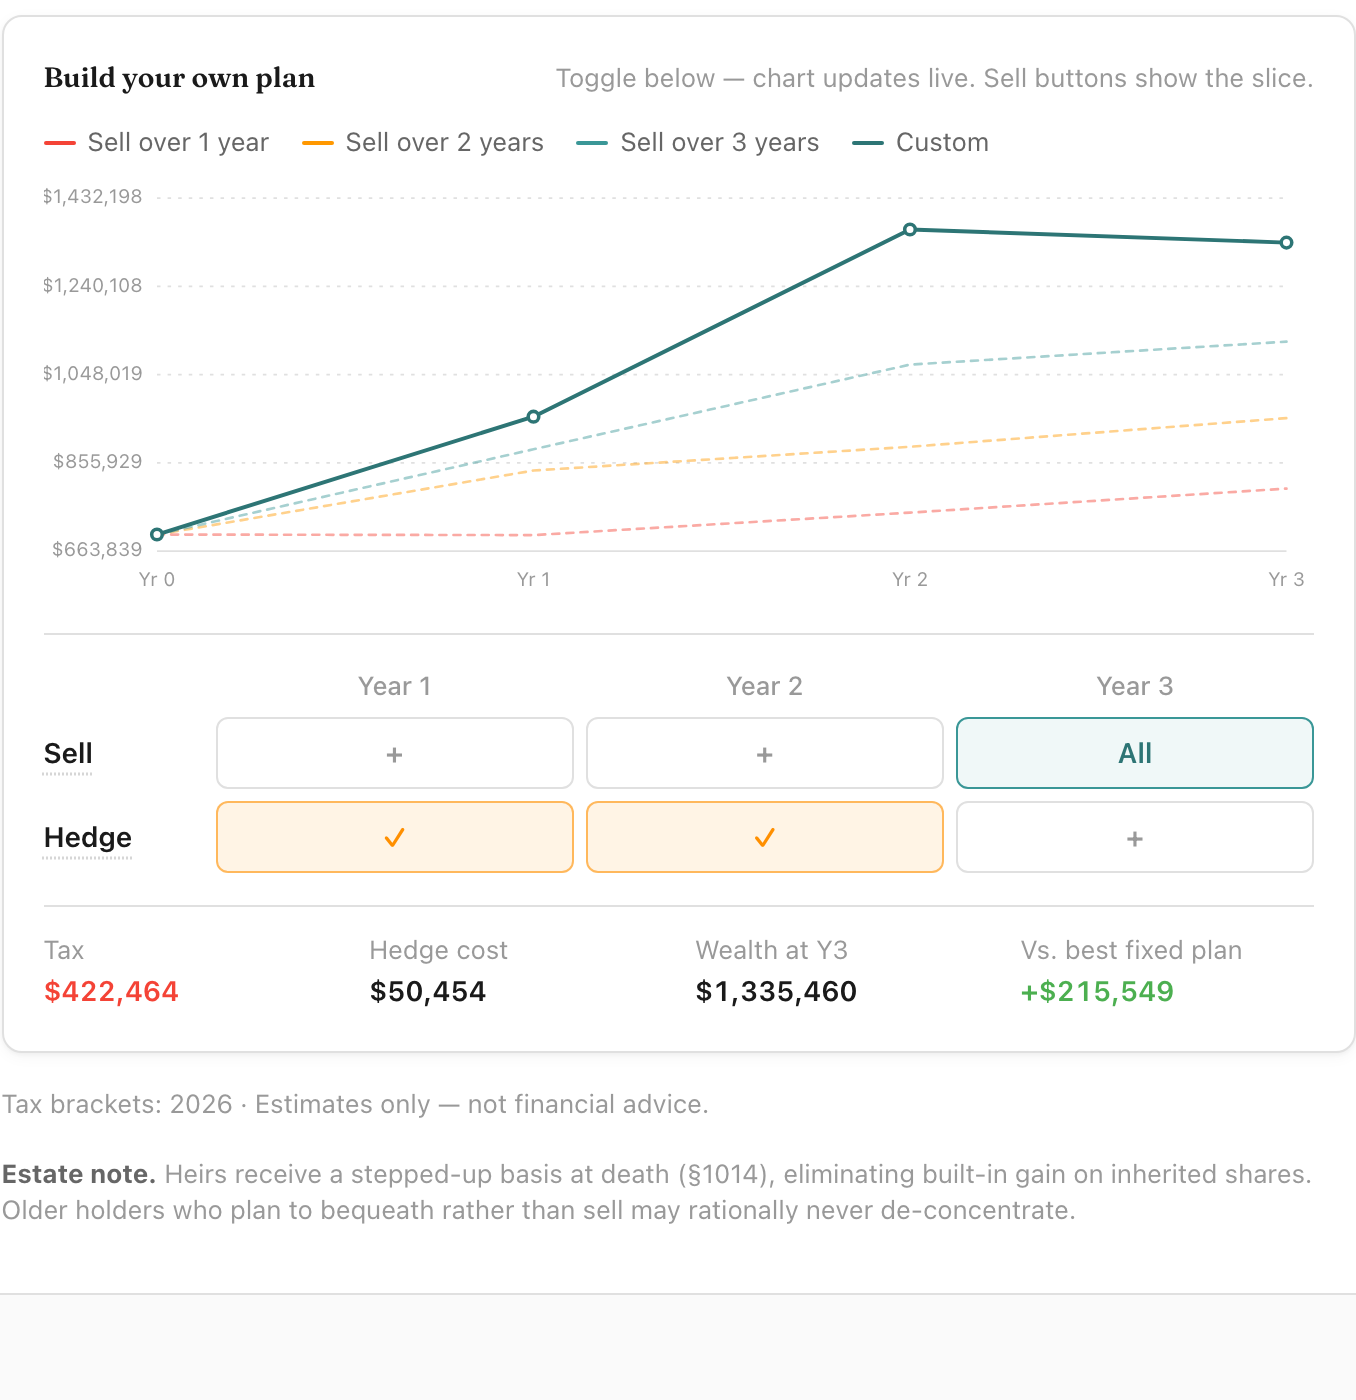
The custom de-concentration plan
The most useful version of this analysis is not "lump-sum vs. 3-year spread." It is year-by-year decisions about how much to sell and whether to hedge the remainder, with end-of-horizon wealth (across reasonable return scenarios) as the outcome. That's a planning exercise the Stock Concentration Calculator is built for: it lets you toggle sell and hedge actions per year and immediately see the resulting end-of-horizon wealth versus the lump-sum-today baseline.
The patterns that tend to show up: a front-loaded sale schedule does well when the position's expected return doesn't beat the market by enough to compensate for concentration risk. A back-loaded schedule with hedges does well when you have soft downside conviction but want to preserve some upside. Lump-sum-today wins outright only in narrow conditions (very low market return assumption, very high gain percentage).
Tools beyond sell-or-hedge
QSBS Section 1202 (for founder and early-employee positions)
If your shares are Qualified Small Business Stock (original-issuance C-corp stock from a small business, held for at least 5 years), you can exclude a significant portion of federal capital gain from tax under IRC §1202. For founders and early employees who hold qualifying shares, this is the single largest tax-saving structure available; it can dwarf every other consideration in this article. The gross-asset cap, per-issuer cap, and holding-period tiers were modernized in recent legislation, so check current rules before relying on older numbers.
Exchange funds
Exchange funds (offered by large brokerages and a handful of newer independent funds) let you contribute your concentrated single-stock position into a commingled fund of other contributors' concentrated positions, in exchange for a pro-rata share of the fund's diversified holdings. The contribution is a tax-deferred exchange (not a sale), but the fund requires a 7-year hold and charges meaningful fees. Worth investigating for positions above roughly $1M when the deferred-tax bill would otherwise be very large. The exchange funds article runs the full worth-it analysis.
Long-short loss harvesting (and direct indexing)
These funds exist to generate tax losses you can use to offset the gains you realize when you sell down your concentrated position, while keeping you invested in the broad market the whole time. Most of the harvested losses are capital in character (matched dollar-for-dollar against the long-term capital gain you're trying to offset); some structures also produce ordinary losses that offset ordinary income.
Tax-aware long-short funds hold a long basket tracking a major index alongside offsetting shorts of correlated names. The shorts let the manager harvest losses on the down-trending side while keeping market exposure roughly neutral. Typical minimums run $1M+ and fees 1-2% annually; the strategy generates several years of usable losses before the harvestable pool depletes. Direct indexing funds use a long-only version of the same idea (owning the underlying constituents of an index rather than the index fund itself, then harvesting losses on individual underperformers) at lower fees (roughly 30-50 basis points) and lower minimums, with proportionally smaller annual loss generation. Both pair naturally with a multi-year sell-down. For most readers, direct indexing is the more practical entry point (lower fees, lower minimums, no short-side exposure); reserve long-short tax-aware for very large positions where the boosted loss generation clearly pays for the higher fees and added complexity.
10b5-1 plans
If you are an officer or designated insider, you generally can't sell shares during blackout periods or while in possession of material non-public information. A Rule 10b5-1 trading plan is a pre-set schedule of sales (specific amounts on specific dates, or based on specific price triggers) adopted when you're not in a blackout. Once adopted, sales execute on schedule without further input from you, providing a regulatory safe harbor and removing emotional decision-making.
Step-up in basis at death
Under current federal estate tax law (IRC §1014), your cost basis in the position resets to the market value on the day you die. Heirs can then sell the shares with no capital-gains tax owed on appreciation that occurred during your lifetime. This is a real consideration for large positions held by older equity holders, where the basis is low and the position is intended to pass to heirs. It does not help you during your lifetime; it shifts the trade-off toward holding rather than selling, on the margin.
Charitable remainder trusts (CRTs)
For very large concentrated positions where the deferred-tax bill is enormous and philanthropic intent is real, a charitable remainder trust can be structured to receive the concentrated position, sell it inside the trust (no immediate capital-gains tax owed by you), pay you an income stream for a term of years or for life, and pass the remainder to a charitable beneficiary. Up-front charitable deduction. Worth professional advice; the structure is complex.
Where to go from here
For your specific position, the Stock Concentration Calculator quantifies your drawdown exposure in dollars, runs sell-down vs. hedge side by side, and lets you build a custom multi-year de-concentration plan with year-by-year sell and hedge actions.
If you're leaning toward hedging rather than selling, the zero-cost collars article covers the structure in depth. If your concentration is still growing from RSU vests or NSO exercises, the RSU withholding gap and NSO sell-vs-hold articles cover the upstream events.
The calculators here handle one decision in isolation. OptionsAhoy plans the full picture jointly: every ISO, NSO, RSU vest, concentrated position, and hedge, across bullish, neutral, and bearish scenarios. The output is a year-by-year Plan optimized for total after-tax wealth. Free during beta.
Common questions
Selling concentrated stock triggers capital gains tax. What is the right framework to decide how much to sell?
Weigh the certain tax cost of selling against the uncertain risk cost of holding, both measured after tax. Size the risk first: a position that is a large share of your net worth in one volatile name can lose more in a normal drawdown than the tax would cost to trim. For a $500,000 single-stock position that is 42% of a $1.2 million portfolio, a 50% drawdown is a $250,000 loss, while selling spreads long-term capital-gains tax (15% or 20% federal, plus the 3.8% Net Investment Income Tax and state) across the gain you choose to realize. The framework is to sell down to a weight you could hold through a 50% drop, spread sales across tax years to stay in lower brackets, and hedge the remainder if needed. The concentration tool compares sell-down, hold, and hedge after tax.
Educational content for general information, not personalized tax, legal, or financial advice. Consult a qualified professional for your specific situation. See Terms.