You hold a large position in one stock and don't want to sell. Maybe for tax reasons, maybe because you still believe in the upside. The textbook hedge is a protective put: a contract that pays out if the stock drops below a chosen price. The zero-cost collar funds that put by selling a call above a higher chosen price. Both work, until they don't.
A hedge that costs more than the loss it averts is not protection. It's a recurring donation to the option market.
The seven most expensive hedging mistakes
Each of these seven erases the protection you paid for.
- Buying protective puts on autopilot year after year. A 3%-per-year put premium compounds to roughly 26% of position value over 10 years if the stock holds flat. That drag is worth paying when the protection floor is set to cover a realistic downside. What's realistic? We work this out with live numbers from the Protect Your Stock Calculator further down.
- Setting the floor so deep the put almost never fires. Useful benchmark: the 1-in-10 bad year, the drop you'd expect about once a decade. If your floor sits below that, the put barely activates; the premium pays for protection on outcomes rarer than once a decade. The calculator flags it when the bad-year price doesn't cross the floor, or when the premium runs too high per dollar of bad-year coverage.
- Setting the floor so shallow the hedge eats your upside. The opposite failure. A floor close to today's price makes the put expensive enough to consume most of the typical-year profits you'd expect from the position. The protection is fairly priced; the question is whether you want to give up that much expected return to cover a small drop. If the premium tops half your expected typical-year return, you've hedged out the reason you held the stock.
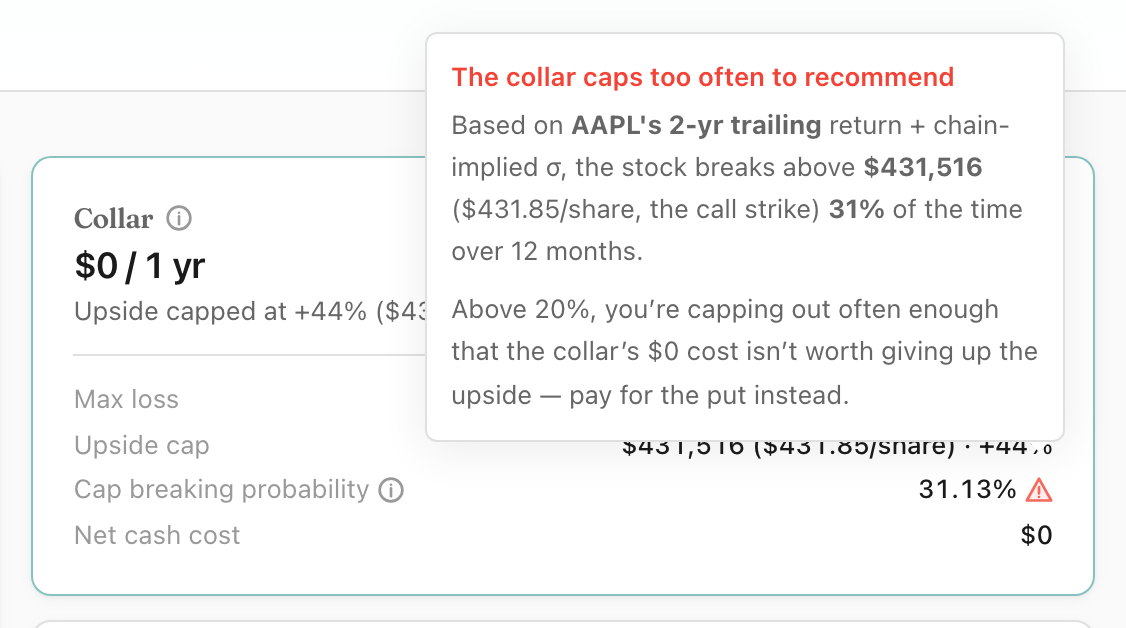
- Treating the zero-cost collar as actually free. The dollar cost is zero; the economic cost is the upside you give up above the cap. When the cap sits close enough that the stock realistically crosses it during the contract, the structure stops being economically free even though the cash cost stays zero. We'll warn you if there's more than a 20% chance the stock crosses the cap. Live AAPL example below.
- Hedging before you've settled what you want from the position. The hedge depends on the goal: preserving today's value, deferring the gain into next year, locking a floor against career risk, holding through QSBS qualification, or stepping up basis at death. Each goal points to a different hedge, or to no hedge. Decide the portfolio question first (trim, hold, hedge, reinvest), then size the hedge to match. Whole-portfolio optimization, through professional financial advice and tools like OptionsAhoy, comes before the position-level decision.
- Adjusting the trade after you put it on. Buying back the call, closing the put early, rolling to new strikes: any of these can pull you under the IRS straddle rules. The mechanic: a loss on either side gets added to the stock's cost basis instead of reducing this year's taxes. You don't lose the deduction; the timing slips, sometimes years. Brokerage 1099s usually don't track this. Keep your own record.
- Pricing examples on illiquid option chains. Pricing assumes buyers and sellers at the strikes you want. For a large position on a thinly traded name (recently-IPO'd, mid-cap, low average volume), bid-ask spreads alone can cost 1-2% of position value before you've bought protection.
The protective put baseline
A protective put is a put option on stock you own. It gives you the right to sell at the put's strike (the floor) any time before expiration. If the stock drops below the floor, the put gains value to offset the loss. Otherwise it expires worthless and the premium is the cost of protection.
The premium drag problem
A 3%-per-year premium compounds to roughly 26% of position value over 10 years if the stock holds flat. Whether that drag is worth paying depends on the stock's volatility and how often the floor actually gets tested: a high-volatility name with real crash risk can justify it; a name where the floor never comes into play cannot. The zero-cost collar trades drag for capped upside, which is a different cost shape, not automatically a better one. Price both on your specific position before picking one.
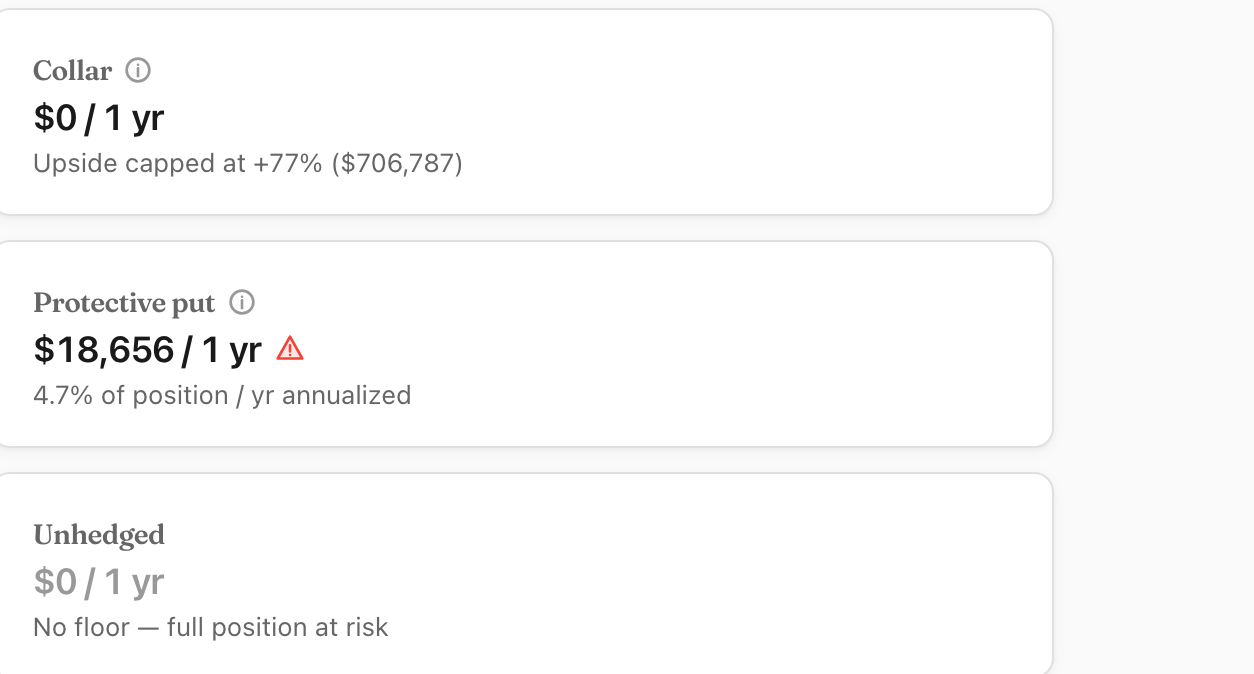
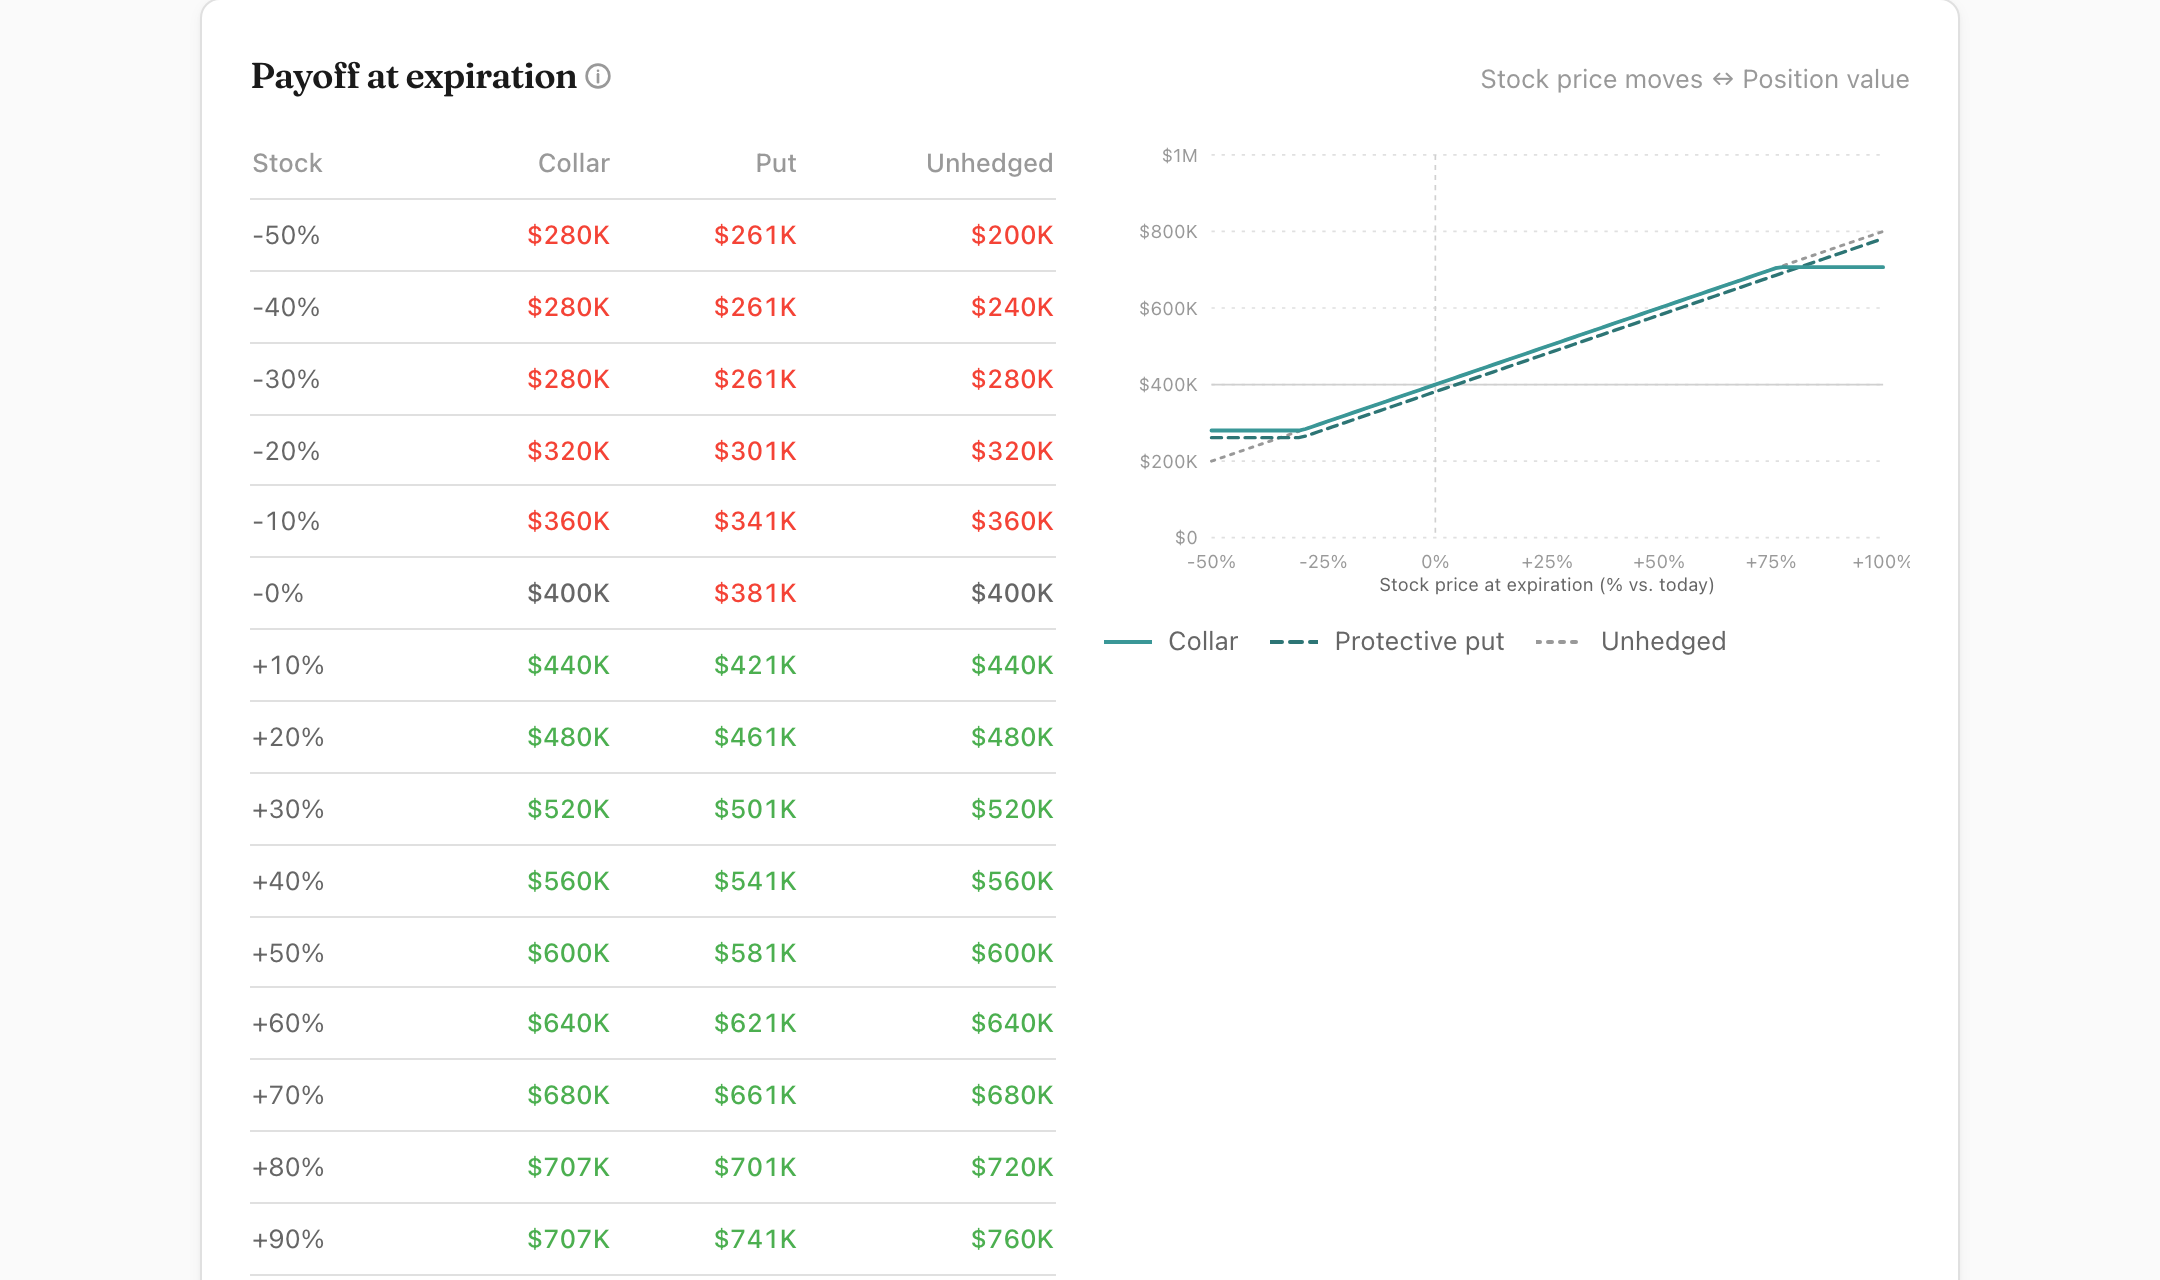
Whether ~$18,650 in cash premium beats capping upside at +77% depends on what you expect from the stock. The payoff comparison makes the trade-off concrete:
The collar structure
A collar adds a second leg: alongside the put at the floor, you sell a call at a higher strike (the cap). The call premium offsets the put premium. If the stock rises above the cap, your shares get called away at that price; your upside stops there. The zero-cost collar is the special case where the call premium exactly matches the put premium: net cost zero, an open-ended position bounded by a floor and a cap.
How the three knobs trade off
You have three inputs to size a collar: floor (how far below the current price you're protected), expiration (how long the protection lasts), and cap (how much upside you give up). The three are coupled: change one and the other two move to keep the net cost near zero.
- Raise the floor (closer to current price): put gets more expensive → cap must drop. More downside protection, less upside.
- Longer expiration: both legs more expensive. Net cost stays near zero, but you're locked in longer. Can't restructure mid-contract without unwinding both legs.
- Raise the cap (keep more upside): call earns less premium → put must be cheaper → floor must drop. More upside, less downside protection.
The natural starting point for most de-concentration plans is a 1-year structure with a floor 30% below the current price, and whatever cap comes out of the math. For real tech names, the cap typically lands well above the current price; we ran the live calc across a spread of names recently and saw +68% (AAPL, implied volatility 34%) up through +98% (ZS, implied volatility 78%). Lower-volatility names produce tighter caps; higher-volatility names give more upside headroom.
When zero-cost collars actually make sense
Collars work well when:
- Your concentration is large enough that the risk matters. The structure has setup friction (option commissions, bid-ask spreads, mark-to-market tax events) that doesn't pay off on small positions.
- You can't sell. Common reasons: insider blackouts, locked-up shares from a recent IPO, tax timing constraints (you want to defer the gain into next year), or QSBS waiting for the 5-year clock to complete (covered in the concentration risk article).
- Implied volatility (IV) is high enough that calls fetch a meaningful premium. When IV is high, your cap can sit further above the current price for the same downside protection (you give up less upside). This is why collar pricing on a name right after an earnings beat or other volatility-spike event is often better than pricing on a quiet name.
- Your upside conviction is bounded. If you don't realistically expect the stock to double in the next year, you're giving up upside you didn't really believe in anyway.
When they don't make sense
- Low implied volatility. Cheap puts AND cheap calls means your cap has to sit close to the current price to fund the put. You give up most of your upside for modest downside protection.
- You're genuinely bullish on a near-term breakout. Capping at $96-$100 when you think the right answer is $150-$200 means you'd rather take the unhedged risk than cap the upside.
- The position is small. The structural overhead isn't worth it for a position you could just liquidate cleanly.
Tax mechanics: the part most pricing pages skip
Section 1092 straddle rules
A long stock + long put + short call combination can count as a tax straddle under IRC §1092. The general rule: if you have a loss on one leg and an unrecognized gain on the offsetting leg, the loss is deferred until the offsetting position is closed. In a collar context, this means you can't necessarily recognize a put loss while still holding the appreciated underlying: the loss is deferred into the basis of the stock.
For a typical 1-year collar held to expiration where the stock, put, and call all settle at the same time, the practical impact is small. But adjusting any leg before expiration (rolling the call up after a rally, closing the put early when it gets expensive) can trigger straddle treatment, which often surprises people at tax time.
Qualified covered calls (the safe harbor)
IRC §1092 has a specific safe harbor for qualified covered calls: a short call against a stock you already own, where the strike is not deep-in-the-money relative to the previous day's close (strikes at-or-above previous close clearly qualify; strikes slightly below the close generally do; strikes well below do not). Calls written within this boundary are exempt from the straddle rules, and the long-term-holding clock on the underlying stock keeps running while the call is open.
Calls with strikes above the current stock price (the kind used to fund a collar's put) almost always qualify. Calls with strikes well below the current price do not. For collar structures specifically, this is usually fine (the cap is set above current price), but worth verifying with your tax preparer if you're getting aggressive with the structure.
What happens at expiration
If the stock ends between the floor and the cap, both options expire worthless and your stock is unchanged. No tax event. The premiums you paid and received offset within the option chain itself.
If the stock ends below the floor and you exercise the put (or it auto-settles), you sell your shares at the floor strike. That's a sale, taxed at LTCG if you've held the underlying 12+ months from the original acquisition date, short-term otherwise.
If the stock ends above the cap and your shares are called away, that's also a sale at the cap strike: same LTCG/STCG treatment depending on holding period of the underlying.
Section 1256 (60/40 treatment) and index options
Options on broad-based stock indexes (SPX, NDX, RUT, etc.) qualify under IRC §1256: gains and losses are treated as 60% long-term, 40% short-term regardless of holding period, marked to market at year-end. This treatment does not apply to options on individual stocks. If you're hedging a single-stock concentrated position with single-stock options, you're under §1092 (the straddle rules above), not §1256.
Where to go from here
For your specific position, the Protect Your Stock Calculator prices both legs off the current option chain for your ticker. You set the floor, expiration, and cap; the calculator returns the net cost (or net credit), the max loss, and the upside cap in dollars.
Collars are one tool in a broader de-concentration toolkit. The concentration risk article covers the framework for deciding how much to sell, hedge, and keep unrestricted. If upstream RSU or NSO events are still feeding the concentration, the RSU withholding gap and NSO sell-vs-hold articles cover those.
The calculators here handle one decision in isolation. OptionsAhoy plans the full picture jointly: every ISO, NSO, RSU vest, concentrated position, and hedge, across bullish, neutral, and bearish scenarios. The output is a year-by-year Plan optimized for total after-tax wealth. Free during beta.
Common questions
How much does a protective put cost on a $500K single-stock position over 12 months?
For a $500,000 position in a typical technology single name (implied volatility around 43%), a protective put struck 10% below the current price for 12 months costs roughly $49,000, about 9.9% of the position. That premium buys a floor: your worst-case loss is capped near $99,000 (the 10% gap down to the strike plus the premium) instead of the full position. Cost rises with volatility, with how close the strike is to the current price, and with tenor. The protective-put calculator prices it for your stock and strike.
How does a zero-cost collar work and when should I use one on concentrated stock?
A zero-cost collar pairs a protective put with a sold call whose premium pays for the put, so there is no net cash outlay. On the same $500,000 technology position, a collar with a floor 10% down can be financed by capping upside at about 28%: your worst case is a $50,000 loss and your best case is a roughly $139,000 gain, for $0 premium. Use a collar when you want downside protection on a concentrated position you cannot or do not want to sell yet (for tax, lockup, or 10b5-1 reasons) and you are willing to give up the far upside. The calculator solves for the upside cap that makes the collar zero-cost.
Educational content for general information, not personalized tax, legal, or financial advice. Consult a qualified professional for your specific situation. See Terms.